Unit 6 - Motion
Key Concept - Change - All things move. This change in position can be described using mathematics
Related Concepts - Motion - The mathematical description of motiont is one of the fundamental pillars of modern scientific knowledge.
Global Concept - Orientation in Time and Space - not just the physical space is important, but the study of how our knowledge of motion has developed runs parallel to our deepest understanding of the Universe and how it works.
Key Words
|
|
|
|
Task guide
The tasks and questions on the Weebly will be coloured to represent the different style of questions that you will find in your exams. The task should be completed in your "Natural Sciences" GoogleDrive document.
Green - Stating scientific knowledge
Orange - Applying scientific knowledge and understanding
Red - Analysing and evaluating information
If the task has two aspects, it will be coloured according to the higher level skill needed.
There will also be "extension" tasks for students who finish tasks quickly! Also look out for links to interactive resources and videos.
Kinematics - The study of motion and its components
Everything moves. Even things that you think are static, think of the moon, the earth, the sun, our galaxy; things you can't see, like air, bacteria and dust particles - but is this movement just random, or can we describe and predict it?
As we will see in the next unit, an object’s change of motion is due to an unbalanced force acting upon it.
Therefore, “an object at rest stays at rest and an object in motion stays in motion with the same speed and in the same direction unless acted upon by an unbalanced force”. Once an unbalanced force acts upon it, the object will experience some type of acceleration.
A movement is a body’s change of position with time.
● Motion is relative: the change of position is made with reference to a point we call a reference system.
(Imagine a train in motion, passengers in the train and trees along the railway. How many different reference systems can you find in the scenario? )
The average speed of a moving object is the displacement of the object divided into the time the object takes to cover a distance.
speed (s) = distance covered (d)
time (t)
The instantaneous speed of a moving object is the speed of the object at a particular instant.
3. Acceleration:
The accelerated movement is a movement in which velocity changes with time.
The acceleration of a movement is the rapidity with which its velocity changes.
● Motion is relative: the change of position is made with reference to a point we call a reference system.
(Imagine a train in motion, passengers in the train and trees along the railway. How many different reference systems can you find in the scenario? )
- The line which describes the displacement of a body in motion is called its trajectory.
- Speed refers to how fast an object is moving, it is therefore the rate at which an object covers a distance. Speed has a different meaning than velocity, as speed is a scalar quantity and velocity is a vector quantity. Velocity is speed in a given direction. For our purposes, as since we are not going to see vectors this year, we may interchange the terms speed and velocity.
The average speed of a moving object is the displacement of the object divided into the time the object takes to cover a distance.
speed (s) = distance covered (d)
time (t)
The instantaneous speed of a moving object is the speed of the object at a particular instant.
3. Acceleration:
The accelerated movement is a movement in which velocity changes with time.
The acceleration of a movement is the rapidity with which its velocity changes.
| speed_distance_time_l7.pdf |

Uniform rectilinear motion (URM)
ParaIn a rectilinear motion, the trajectory is a straight line. (such as the free fall of an apple from a tree).
For a uniform rectilinear motion, the trajectory is a straight line and the velocity is constant.
For a uniform rectilinear motion, the trajectory is a straight line and the velocity is constant.
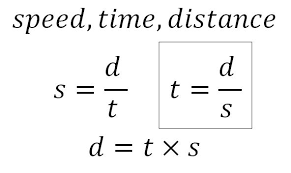
So, the speed or velocity equation for URM is:
Where:
s = speed or velocity
so, s and v would both represent the same thing
d = distance
t = time
(google images, 2016)
Where:
s = speed or velocity
so, s and v would both represent the same thing
d = distance
t = time
(google images, 2016)
How to solve problems using the triangle
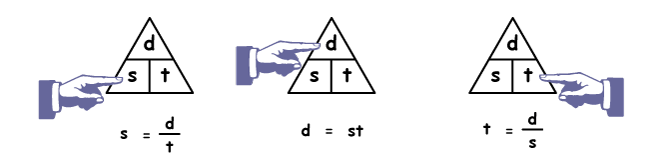
(Drcruzan.com, 2015)
Graphs to represent URM
|
Task 7a - calculate your average speed for your journey to school.
If we want to know your average speed, we need to know several things
Do you think this speed would be the same every day? what would happen if there was an accident one day, or it rained? How could we find a way to take into account all these occurences? |
(Cbpr.me, 2015)
|
In order to get a resprentative result of the different days, we calculate the ARITHMETIC MEAN value (la media).
We calculate this by taking all the indivdual values that we have measured adding them all up and then dividing the total by the number of values we have.
We calculate this by taking all the indivdual values that we have measured adding them all up and then dividing the total by the number of values we have.

The 'x' with the line we call 'x bar' this is the symbol for the mean value,
x is the value we have measured, in this task it is the time taken for the journey,
n is the number of times we have taken the measurement.
So, if you do the journey five times in one week, you can record your five journey times, add them up, then divide the total by five, you can complete the following table:
You should now be able to calculate the average time taken each day
With this value we can use this formula, and calculate the average speed of each day.
With this value we can use this formula, and calculate the average speed of each day.
What units would you use for this?
Include the correct unit in your final calculation
Finally, you can calculate the mean for the 5 days.
Include the correct unit in your final calculation
Finally, you can calculate the mean for the 5 days.
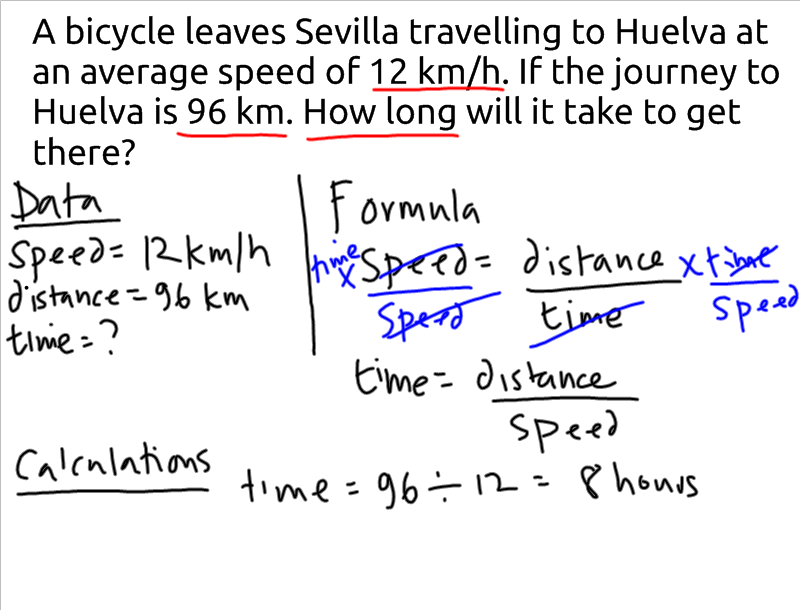
Example worked problems.
A bicycle leaves Sevilla travelling to Huelva at an average speed of 12 km/h. If the journey to Huelva is 96 km. How long will it take to get there?
|
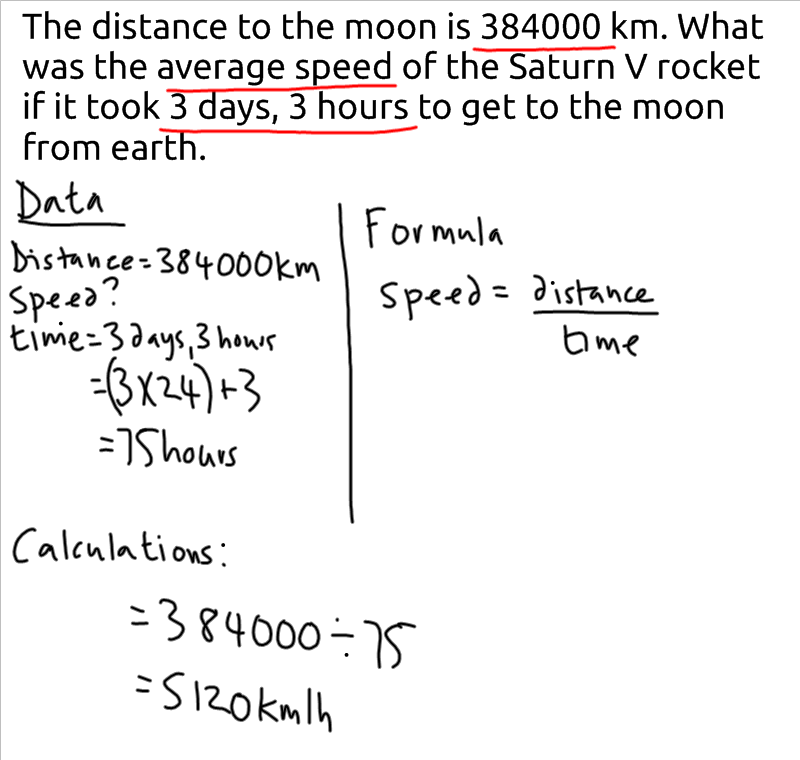
The distance to the moon is 384000 km. What was the average speed of the Saturn V rocket if it took 3 days, 3 hours to get to the moon from earth.
|
|
|
|
Using Graphs to solve problems
Write are the three quantities on the above formula, and what units can we use to quantify them?
We can use graphs to represent these problems too.. The first type we will look at is a 'distance - time' graph
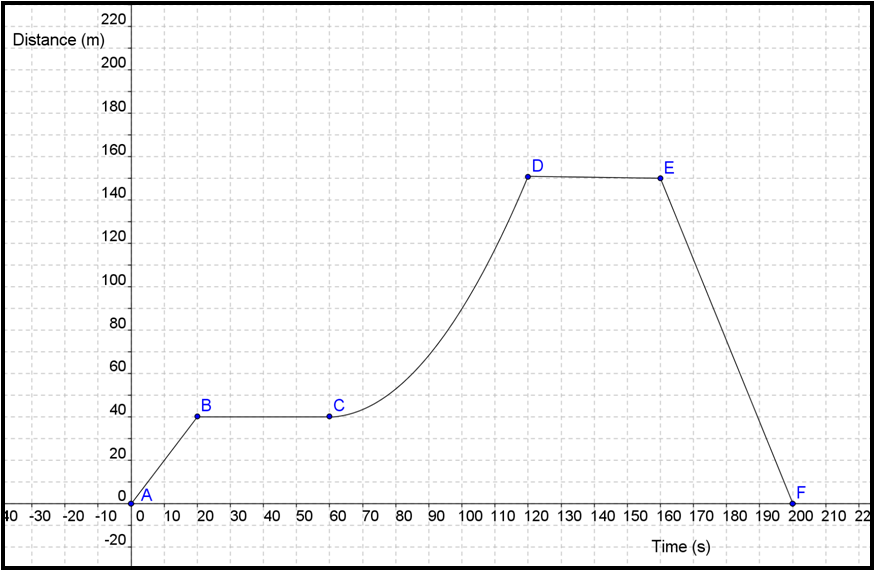
The graph below shows the journey of a meerkat early in the morning, while she is out checking if the coast is clear before all the other meerkats come out and start to do whatever it is that meerkats do.
We can use graphs to represent these problems too.. The first type we will look at is a 'distance - time' graph
The graph below shows the journey of a meerkat early in the morning, while she is out checking if the coast is clear before all the other meerkats come out and start to do whatever it is that meerkats do.

|
In this case, from A to B, she exits the burrow at a constant speed and moves 40 metres from the exit. Then she waits for 40 seconds without moving, then she runs another 100m, getting faster all the time (accelerating). Then she rests for another 40 seconds, before running back to the burrow, all 140 m, in one go in 40 seconds.
|
(Ycecaxihex, 2014)
In this case we can use the graph to see many things.
From A to B:
There is a straight 'upwards sloping line - this indicates that the distance and the time change in the same proportion (a directly proportional relationship) we can calculate the speed in this section by two methods:
From B to C
There is a 'flat' line, this means that the y co-ordinate (distance) is not changing, so the object is still - it's speed is zero m/s
You can do the two calculations to check if you like! (in both cases the change in y is zero, so the answer is zero)
From C to D
This is called an exponential curve, mathematically you will not deal with these this year, but we can talk about what it means without going into the mathematcs yet!
In this case, we can see that curve gets steeper as the time increases, this means that the object is covering more distance in less time - or it is getting faster (accelerated movement). This year we won't be doing any calculations with this type of movement, it is enough for you recognise it, and what it means. In reality this type of movement is very common, so we will come back to this next year
From D to E
At rest no movement
From E to F
This is similar to A to B, in that it is a straight line, but in this case the slope is opposite, (an indirectly proportional relationship).
Doing the same calculations as before - the gradient comes out as negative,
(0-140)/((200-160)= -3.5 m/s.
The '-' sign will be very important in the future, for this year we can say that this means the movement is in the opposite direction - the meerkat is coming back. If this is hard for you to visualise, imagine you were a wildlife film-maker, and you decided to go to get a sandwich for about four minutes, just before the meerkat came out of the burrow. You wouldn't have seen anything would you? The meerkat is back where she started from.
From A to B:
There is a straight 'upwards sloping line - this indicates that the distance and the time change in the same proportion (a directly proportional relationship) we can calculate the speed in this section by two methods:
- distance from the graph = 40m / time from the graph 20s So speed = 40/20 = 2 m/s.
- by calculating the gradient (pendiente) of the line.: Change in y/change in x - in this case (40-0)/(20-0) = +2 m/s
From B to C
There is a 'flat' line, this means that the y co-ordinate (distance) is not changing, so the object is still - it's speed is zero m/s
You can do the two calculations to check if you like! (in both cases the change in y is zero, so the answer is zero)
From C to D
This is called an exponential curve, mathematically you will not deal with these this year, but we can talk about what it means without going into the mathematcs yet!
In this case, we can see that curve gets steeper as the time increases, this means that the object is covering more distance in less time - or it is getting faster (accelerated movement). This year we won't be doing any calculations with this type of movement, it is enough for you recognise it, and what it means. In reality this type of movement is very common, so we will come back to this next year
From D to E
At rest no movement
From E to F
This is similar to A to B, in that it is a straight line, but in this case the slope is opposite, (an indirectly proportional relationship).
Doing the same calculations as before - the gradient comes out as negative,
(0-140)/((200-160)= -3.5 m/s.
The '-' sign will be very important in the future, for this year we can say that this means the movement is in the opposite direction - the meerkat is coming back. If this is hard for you to visualise, imagine you were a wildlife film-maker, and you decided to go to get a sandwich for about four minutes, just before the meerkat came out of the burrow. You wouldn't have seen anything would you? The meerkat is back where she started from.
REFERENCES
Cbpr.me,. (2015). See & Be PR » Cicero & Bernays Public Relations - PR Dubai Blog Clients. Retrieved 1 July 2015, from http://cbpr.me/blog/tag/clients/
Drcruzan.com,. (2015). Speed. Retrieved 1 July 2015, from http://www.drcruzan.com/Speed.html
Ycecaxihex,. (2014). distance vs time graph worksheets. Retrieved 2 July 2015, from http://progsosticmufu.blog.com/2014/02/11/distance-vs-time-graph-worksheets/
Wikipedia,. (2009). Meerkat feb 09.jpg. Retrieved 2 July 2015, from https://en.wikipedia.org/wiki/File:Meerkat_feb_09.jpg
